
During an event, your visitors’ interests change throughout the day. They may be checking schedules before arriving, exploring food options around lunchtime, or looking for entertainment later in the evening.
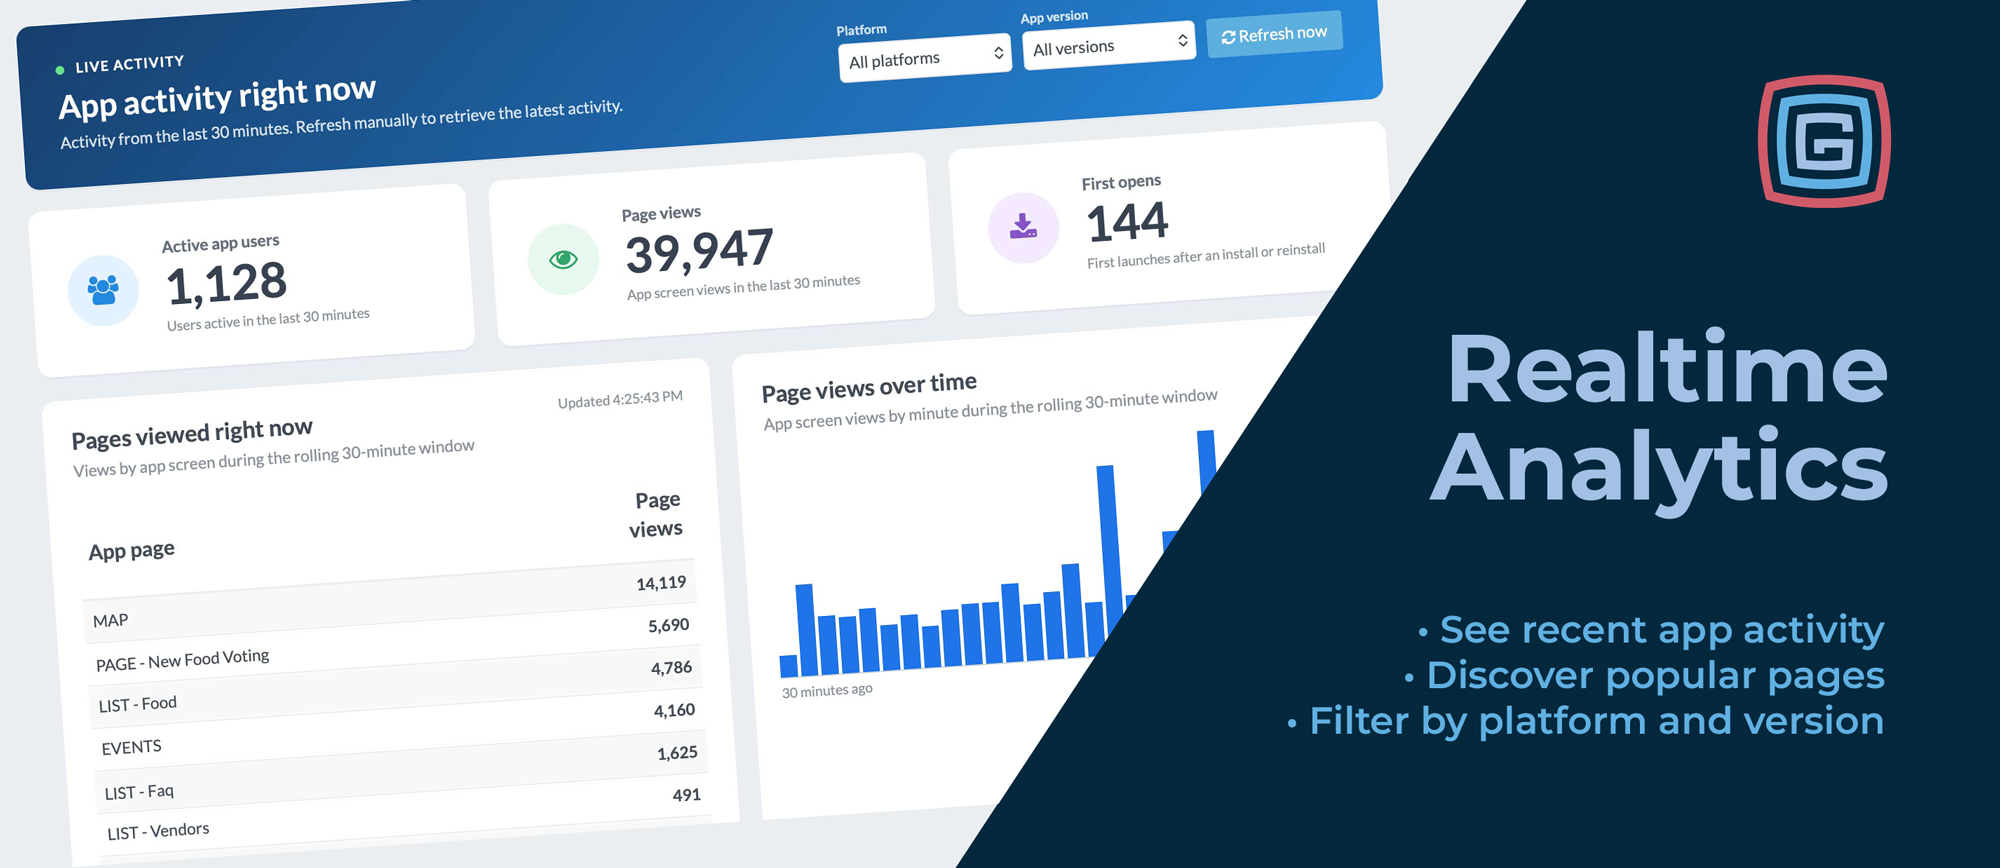
Grandstand’s new Realtime Analytics gives organizers a view of that activity directly inside Admin. Available with Platinum packages and higher, it shows a rolling window of the last 30 minutes of app activity, helping your team see what visitors are exploring.
Open Analytics → Realtime and select Refresh now to retrieve the latest activity.
The dashboard brings several useful measures together:
The active-user total reflects activity throughout the last 30 minutes, rather than a count of people with the app open at that exact instant. Together, these measures help organizers understand both the volume of recent activity and the content attracting attention.
Overall activity tells you how busy the app has been. The page list helps explain what visitors are looking at.
You can see activity across any page in the app, from maps and schedules to individual vendors, event details, FAQs, and custom pages.
Is a featured food vendor getting attention? Are visitors opening the information page you just promoted? Which event details are being viewed as the afternoon gets underway?
Realtime Analytics gives your team a current view of content interest to complement your broader event reporting.
Realtime Analytics can support the decisions and conversations happening throughout your event.
Check activity after a push notification. After sending a message about an upcoming performance or featured attraction, refresh the dashboard to see whether views of the related content increase.
Follow interest in voting and promotions. If you are encouraging visitors to explore a fan-favorite voting page, a special offer, or a featured vendor, watch for activity on that page. Page views show interest; voting or survey reports provide the separate picture of completed participation.
Monitor first opens during app promotion. When you promote the app through social media, signage, or announcements, first opens provide a useful signal of installation activity. These include first launches after both installations and reinstallations.
Check whether new content is being discovered. After adding or highlighting a page, see whether visitors are finding it. That can help your team decide whether it needs a more prominent home-screen placement or another mention.
Notice interest in practical information. Increased views of parking, transportation, or FAQ pages can prompt your team to review whether that information is clear, current, and easy to reach.
Watch planning activity before the gates open. The dashboard is useful before the event, too. See which schedules, food listings, and other pages are attracting attention as visitors prepare for their day.
These patterns can help guide follow-up decisions. A change after a promotion is a useful signal to investigate, even when the dashboard alone cannot establish what caused it.
You can view activity across all platforms and versions or narrow the dashboard to a specific platform, app version, or combination of the two.
The filters apply across the summary cards, page list, and activity chart, making it easier to focus on recent iOS or Android activity or explore usage from a particular release.
After an app update, for example, your team can see activity coming from the new version and which pages those users are visiting.
Realtime Analytics brings recent app activity into the same Admin where you manage your event content.
For clients with Platinum packages and higher, visit Analytics → Realtime to explore the dashboard. It displays the last 30 minutes of activity and refreshes when you select Refresh now.
Interested in adding these insights to your event toolkit? Contact Grandstand to learn more about availability and package options.
Dashboard images in this article use sample data for illustration.
NEW